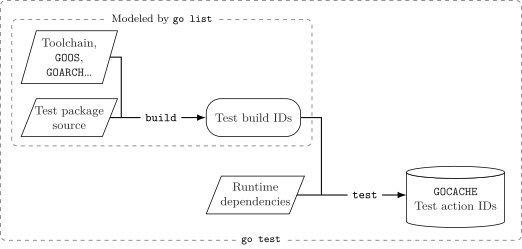
go list are but one factor in the test action IDs cached by
go test. Calculating test action IDs requires running tests
to determine runtime dependencies — too slow for our
purposes.The pièce de résistance in ‘Scaling Golang CI by
Replacing actions/setup-go’ is the conclusion that 86%
of actions/setup-go test package runs are pre-empted by our
improved caching strategy. To summarize the CloudX article, the puzzle
is to optimize use of a fine-grain cache we don’t control (the
GOCACHE) which is saved and loaded through a coarse-grain
cache where we can control cache keys that determine which
instances of the GOCACHE are loaded and saved. CloudX makes
that outer, coarse-grained GitHub Actions cache more granular by writing
to it often and restoring fresher entries.
This comparison between our key strategy and GitHub’s is a counterfactual comparison: the course of action we took against a hypothetical alternative. These are tricky!
We didn’t foresee open-sourcing cloudx-io/setup-go, so
we never ran it alongside actions/setup-go simultaneously
to benchmark their relative performance; we just switched, realized
savings, and never looked back.
To claim a general improvement — not just an improvement for a short, potentially unrepresentative period — I needed to show an advantage over an extended interval, including different paces of development on different kinds of features. I picked a 4,000-commit range, our latest few months of development.
How would you backtest GitHub Actions performance for 4,000 commits?
Maybe replay comes to mind. We have the full commit history; we
could create a repository using each Actions strategy and apply each
monorepo commit one at a time, recording cache-hit rates at each commit.
Alternatively, we could simulate the Actions behavior locally
and using the GOCACHE environment variable to point
go test runs at the faux-Actions cache to “restore.”
Neither of these approaches works because running tests is slow. Even if the suite takes two minutes to run per commit on average (optimistic), testing each of 4,000 commits in series would take more than five days per tested treatment.1
For the moment, let’s set aside GitHub and focus on the fine-grained
record of test runs in GOCACHE. What causes a test cache
miss? When you change a test package from whatever version populated the
cache, the next go test will miss the cache and every test
case will run anew. When the tests run, the command output notes how
long they took; when they don’t run because the cache held a prior
result, the output notes that instead:
$ go test ./...
ok      lukasschwab.me/demo/pkg/place   0.319s
ok      lukasschwab.me/demo/pkg/time    (cached)
Because a change that requires a fresh test run could occur in the
test package itself or in any of its transitive dependencies,
predicting test reruns isn’t as simple as checking whether the source
files were updated. Thankfully, we can detect package changes without
running go test or modeling package dependencies
ourselves! The go list tool emits a build ID that
uniquely represents the test package logic, transitive dependencies
included:
go list -export -json -test ./... > list-output.jsonI recommend poking around that output if you’re curious how the Go
build tools process the code you feed them. For our purposes, we just
need to know the build IDs for test packages, which have import paths
ending in .test:
$ jq -cr 'select(.ImportPath | endswith(".test")) | .BuildID' list-output.json
IbwMxcbMdIQEtYuf-iSx/4BSEJASXWdJsxiNf26cO
wIuIuummvmYTa4K267jr/weIdkEXe9zK5LWUoPeyV
…
This command builds the test binaries and exactly identifies them
with build IDs, but never actually runs any tests. When the build ID for
a given test package changes, the cached output no longer attests to the
validity of the current build. go test misses the cache and
runs the full test package from scratch.
# Get some baseline build IDs for a demo module.
$ go list -export -json -test ./... \
    | jq -cr 'select(.ImportPath | endswith(".test")) | {(.ImportPath): .BuildID}'
{"lukasschwab.me/pkg/place.test":"IbwMxcbMdIQEtYuf-iSx/4BSEJASXWdJsxiNf26cO"}
{"lukasschwab.me/pkg/time.test":"wIuIuummvmYTa4K267jr/weIdkEXe9zK5LWUoPeyV"}

# Run tests to populate the GOCACHE.
$ go test ./...
ok      lukasschwab.me/pkg/place   0.319s
ok      lukasschwab.me/pkg/time    0.313s

# Modify one test package.
$ echo "const A = iota" >> pkg/time/time_test.go

# The build ID for time.test is changed...
$ go list -export -json -test ./... \
    | jq -cr 'select(.ImportPath | endswith(".test")) | {(.ImportPath): .BuildID}'
{"lukasschwab.me/pkg/place.test":"IbwMxcbMdIQEtYuf-iSx/4BSEJASXWdJsxiNf26cO"}
{"lukasschwab.me/pkg/time.test":"12RAxSa7r2gXeNxG9oHO/HDMEw48BALCftV8lUnlj"}

# ...so it gets a fresh test run!
$ go test ./...
ok      lukasschwab.me/pkg/place   (cached)
ok      lukasschwab.me/pkg/time    0.386s
In short, we can use go list outputs to take one commit
and understand what test results it’ll store in the
GOCACHE; then we can use go list to see, for
another commit, which test packages can be skipped on the basis of those
stored results and which test packages, changed between the two commits,
need fresh runs.
Realizing this fast approach for counting test package runs without
running tests was the crux of the CloudX backtest: I generated test
build ID sets for each of the 4000 commits.2 By
modeling the actions/setup-go and
cloudx-io/setup-go key-lookups in the coarse-grained GitHub
Actions cache, I identified which pairs of commits would write and
restore that cache, then I used build IDs to estimate the 86%
improvement.
We can assess further changes to the cache key scheme by backtesting it against the same build ID dataset — these are just more counterfactuals.
Close-readers of ‘Poisoning a Go Cache’ might be surprised by my focus on build IDs here. Build IDs don’t appear in the Go cache, it’s true! The cache stores test outcomes under a test action ID. The built test packages are one factor in the action ID hash, but a change in any factor can — if we’re being precise — cause a cache miss, and therefore a test rerun.
In practice, this means our backtest underestimates the number of test runs for both the control and treatment key schemes. The absolute measurement effect should be roughly the same for both branches, but underestimation slightly skews percentage-improvement estimates. Sue me!
This backtest also ignores timing effects: it assumes the GitHub
Actions cache includes all prior commits’ outputs before the
next commit’s setup-go step picks one of those outputs to
load. Depending on how you configure your repository, commits may merge
in quick succession and their CI may run in parallel, using staler
caches than our idealized model suggests.
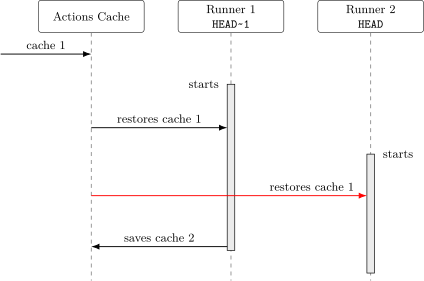
It’s harder to say how this affects our measurements. Loading a
staler cache typically prolongs a CI job, predisposing the next job in
the sequence to also load a staler cache. The two setup-go
strategies also affect job runtimes through factors other than
test-cache hits, because they save and load caches of different sizes
(see discussion of ‘pruning’ in the CloudX post).
Nevertheless, I’m pretty satisfied with the experimental method here, especially because it should allow another team to make an adoption decision tailored to their codebase: different Go dependency trees, subject to different development patterns, will exhibit different cache invalidation patterns even with an ideal cache.
cloudx-io/setup-go works for us! Your mileage may vary,
and now you can measure by how much.
Instead, one could sample commits from the range and extrapolate from there.
setup-go cache keys for each commit in the
range (cheap).GOCACHE=/tmp/cacheB go test /b/... for β and
GOCACHE=/tmp/cacheC go test /c/... for θ.GOCACHE=/tmp/cacheB go test /a/... against
GOCACHE=/tmp/cacheC go test /a/....You could test samples in parallel, but those cold builds in step 3
are expensive. There may be some mark-and-sweep approach for isolating
cacheB and cacheC contents from a shared
cache, but at some point these optimizations introduce measurement risk.
I didn’t bother.↩︎
Originally I wanted a script I could run with
git rebase --exec (great trick for running code against
every commit in a range), but our real repo history proved too
complicated. Occasionally main includes a failing build,
for example. Also, I wanted parallelism.
My bodge looped over commits in a range and fed them to a workerpool.
Each worker managed a worktree, checked out a commit, ran
go list -trimpath (the -trimpath term is
necessary for comparing build IDs between worktrees), and recorded the
results. Every several commits, the script cleared and re-warmed the
shared GOCACHE to prevent it exhausting available
storage.
My work laptop was essentially unusable the whole time.↩︎